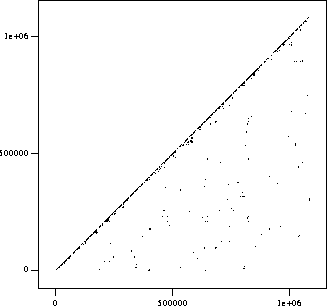
This scatter plot represents parameterized duplication found by Dup in a production subsystem containing over a million lines of code. Each "point" is actually a line segment representing a parameterized match between two sections of code. For example, a line segment from (30000,40000) to (30100,40100) would represent a match between lines 30000-30100 and 40000-40100. Only line segments below the main diagonal are plotted, so that each match corresponds to exactly one line segment in the plot; a complete plot would be symmetric around the main diagonal.
No line segments are plotted exactly on the main diagonal; the apparent density near the main diagonal indicates that there are many matches that are fairly local with respect to this amount of code, e.g. within the same file or module. However, the apparent density is misleading at this scale because the apparent density is greater than the actual density.